In today’s digital landscape, where users expect lightning-fast experiences, monitoring your website performance is no longer optional—it’s essential. Whether you’re running an e-commerce store, a blog, or a corporate site, slow load times or glitches can drive visitors away, hurt your search rankings, and ultimately impact your bottom line. As we move into 2025, with advancements in web technologies and increasing mobile usage, keeping tabs on how your site performs has become a critical part of any online strategy.
But what does it mean to monitor your website performance? It involves tracking various metrics that indicate how quickly and efficiently your site loads, how users interact with it, and whether it’s delivering a seamless experience across devices. Tools like GTmetrix and Google PageSpeed Insights make this process accessible, providing insights that help you identify bottlenecks and optimize accordingly. According to recent data, websites that load in under three seconds see significantly lower bounce rates and higher conversion rates.
This comprehensive guide will walk you through why you should monitor your website performance, the key metrics to watch, the best tools available in 2025, setup steps, best practices, and real-world case studies. By the end, you’ll have the knowledge to implement effective monitoring and boost your site’s success. Let’s dive in.
![]()
A typical website performance monitoring dashboard showing key metrics like visits, bounce rate, and traffic sources.
Why Monitor Your Website Performance?
Monitoring your website performance is akin to regular health check-ups for your body—it helps prevent small issues from becoming major problems. In an era where attention spans are shorter than ever, a sluggish site can lead to frustrated users who abandon your page before it even fully loads.
Benefits of Monitoring Website Performance
The advantages are multifaceted. First, it enhances user experience (UX). Fast-loading sites keep visitors engaged, leading to longer session durations and more pages viewed per visit. For instance, improving load times can reduce bounce rates by up to 32%, as users are more likely to explore further when they’re not waiting.
Second, it boosts SEO rankings. Google has incorporated Core Web Vitals into its ranking algorithm since 2021, and in 2025, these metrics are even more influential. Sites that perform well in areas like loading speed and interactivity rank higher, driving organic traffic.
Third, it increases conversions and revenue. Studies show that a one-second delay in page load can reduce conversions by 7%. For e-commerce, this translates to millions in lost sales annually. Monitoring allows you to optimize for speed, directly impacting your bottom line.
Additionally, performance monitoring aids in proactive issue resolution. By tracking metrics in real-time, you can detect downtime or errors before they affect many users, maintaining trust and reliability. It also provides data for informed decision-making, such as when to scale servers or optimize code.
Finally, in a competitive market, superior performance differentiates your site. Users today expect seamless experiences across desktops, mobiles, and varying network conditions. Regular monitoring ensures your site meets these expectations, fostering loyalty and positive reviews.
Consequences of Neglecting Website Performance
Ignoring performance monitoring can be costly. High bounce rates are a common outcome— if your site takes more than three seconds to load, over 50% of mobile users will leave. This not only loses potential customers but also signals to search engines that your content isn’t valuable, harming rankings.
Security risks increase too; unmonitored sites might miss vulnerabilities exposed by slow performance, like inefficient code that could be exploited. Moreover, poor performance leads to negative user feedback, damaging your brand’s reputation.
Financially, the impact is stark. For large sites, even minor slowdowns can result in substantial revenue loss. One case study showed a 100ms improvement in load time boosting revenue by 1%. Neglect can also lead to higher operational costs, as reactive fixes are more expensive than preventive measures.
In summary, the benefits far outweigh the effort, making monitoring a must for any serious website owner.
Key Metrics to Monitor for Website Performance
To effectively monitor your website performance, focus on metrics that reflect user experience and technical health. These can be divided into core and supplementary categories.

Graph illustrating Core Web Vitals performance over time, highlighting improvements in site health.
Core Web Vitals
Google’s Core Web Vitals are pivotal in 2025. They include:
- Largest Contentful Paint (LCP): Measures loading performance. Aim for under 2.5 seconds for the main content to appear. Poor LCP often stems from large images or slow server responses.
- Interaction to Next Paint (INP): Replaces First Input Delay, assessing responsiveness. Target below 200ms. High INP indicates JavaScript-heavy pages blocking interactions.
- Cumulative Layout Shift (CLS): Gauges visual stability. Keep it under 0.1 to avoid unexpected shifts that frustrate users. Causes include unsized images or dynamic ads.
These metrics are user-centric and directly influence SEO.
Other Important Metrics
Beyond Vitals, track:
- Time to First Byte (TTFB): The time from request to first byte received. Under 200ms is ideal; high values point to server issues.
- First Contentful Paint (FCP): When the first text or image renders. Target under 1.8 seconds.
- Total Blocking Time (TBT): Measures main thread blockage. Lower is better for interactivity.
- Page Load Time: Overall time to fully load. Aim for under 3 seconds.
- Bounce Rate and Session Duration: Behavioral metrics indicating engagement.
- Error Rates: Track 404s, 500s, etc., for site health.
Using tools to monitor these provides a holistic view, enabling targeted optimizations.
Best Tools for Monitoring Website Performance in 2025
Choosing the right tools is crucial. Here’s a roundup of top options.

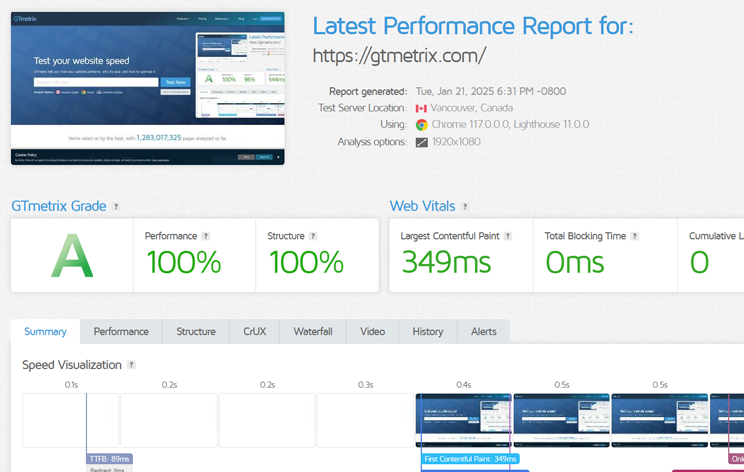
Example of a GTmetrix performance report showing grades and vital metrics.
Free Tools
- GTmetrix: Offers detailed reports on speed, with Lighthouse integration. Great for one-off tests and monitoring.
- Google PageSpeed Insights: Analyzes lab and field data, scoring on mobile/desktop.
- Pingdom Tools: Free speed test with waterfall charts for resource loading.
- Chrome DevTools Performance Monitor: Real-time graphing of CPU, JS heap, etc.
These are ideal for beginners or small sites.
Paid Tools
- DebugBear: Comprehensive monitoring with RUM data and alerts.
- New Relic: End-to-end observability for apps and infrastructure.
- Datadog: Synthetic and real-user monitoring with dashboards.
- SolarWinds Web Performance Monitor: Focuses on application performance.
- Uptrends: Global monitoring with uptime alerts.
For enterprises, these provide advanced features like AI insights and integrations.
How to Set Up Website Performance Monitoring
Setting up is straightforward with the right approach.
Step-by-Step Guide
- Choose Your Tools: Start with free ones like GTmetrix for basics, then scale to paid for continuous monitoring.
- Integrate Tracking Code: For tools like Google Analytics or New Relic, add scripts to your site’s header.
- Define Metrics and Thresholds: Set alerts for when LCP exceeds 2.5s or uptime drops below 99.9%.
- Schedule Regular Tests: Use synthetic monitoring to simulate user visits from various locations.
- Analyze Data: Review reports weekly, identifying trends like slow resources.
- Optimize Based on Insights: Compress images, minify CSS, or use CDNs.
- Monitor Continuously: Enable real-time alerts via email or Slack.
Following these steps ensures proactive management.

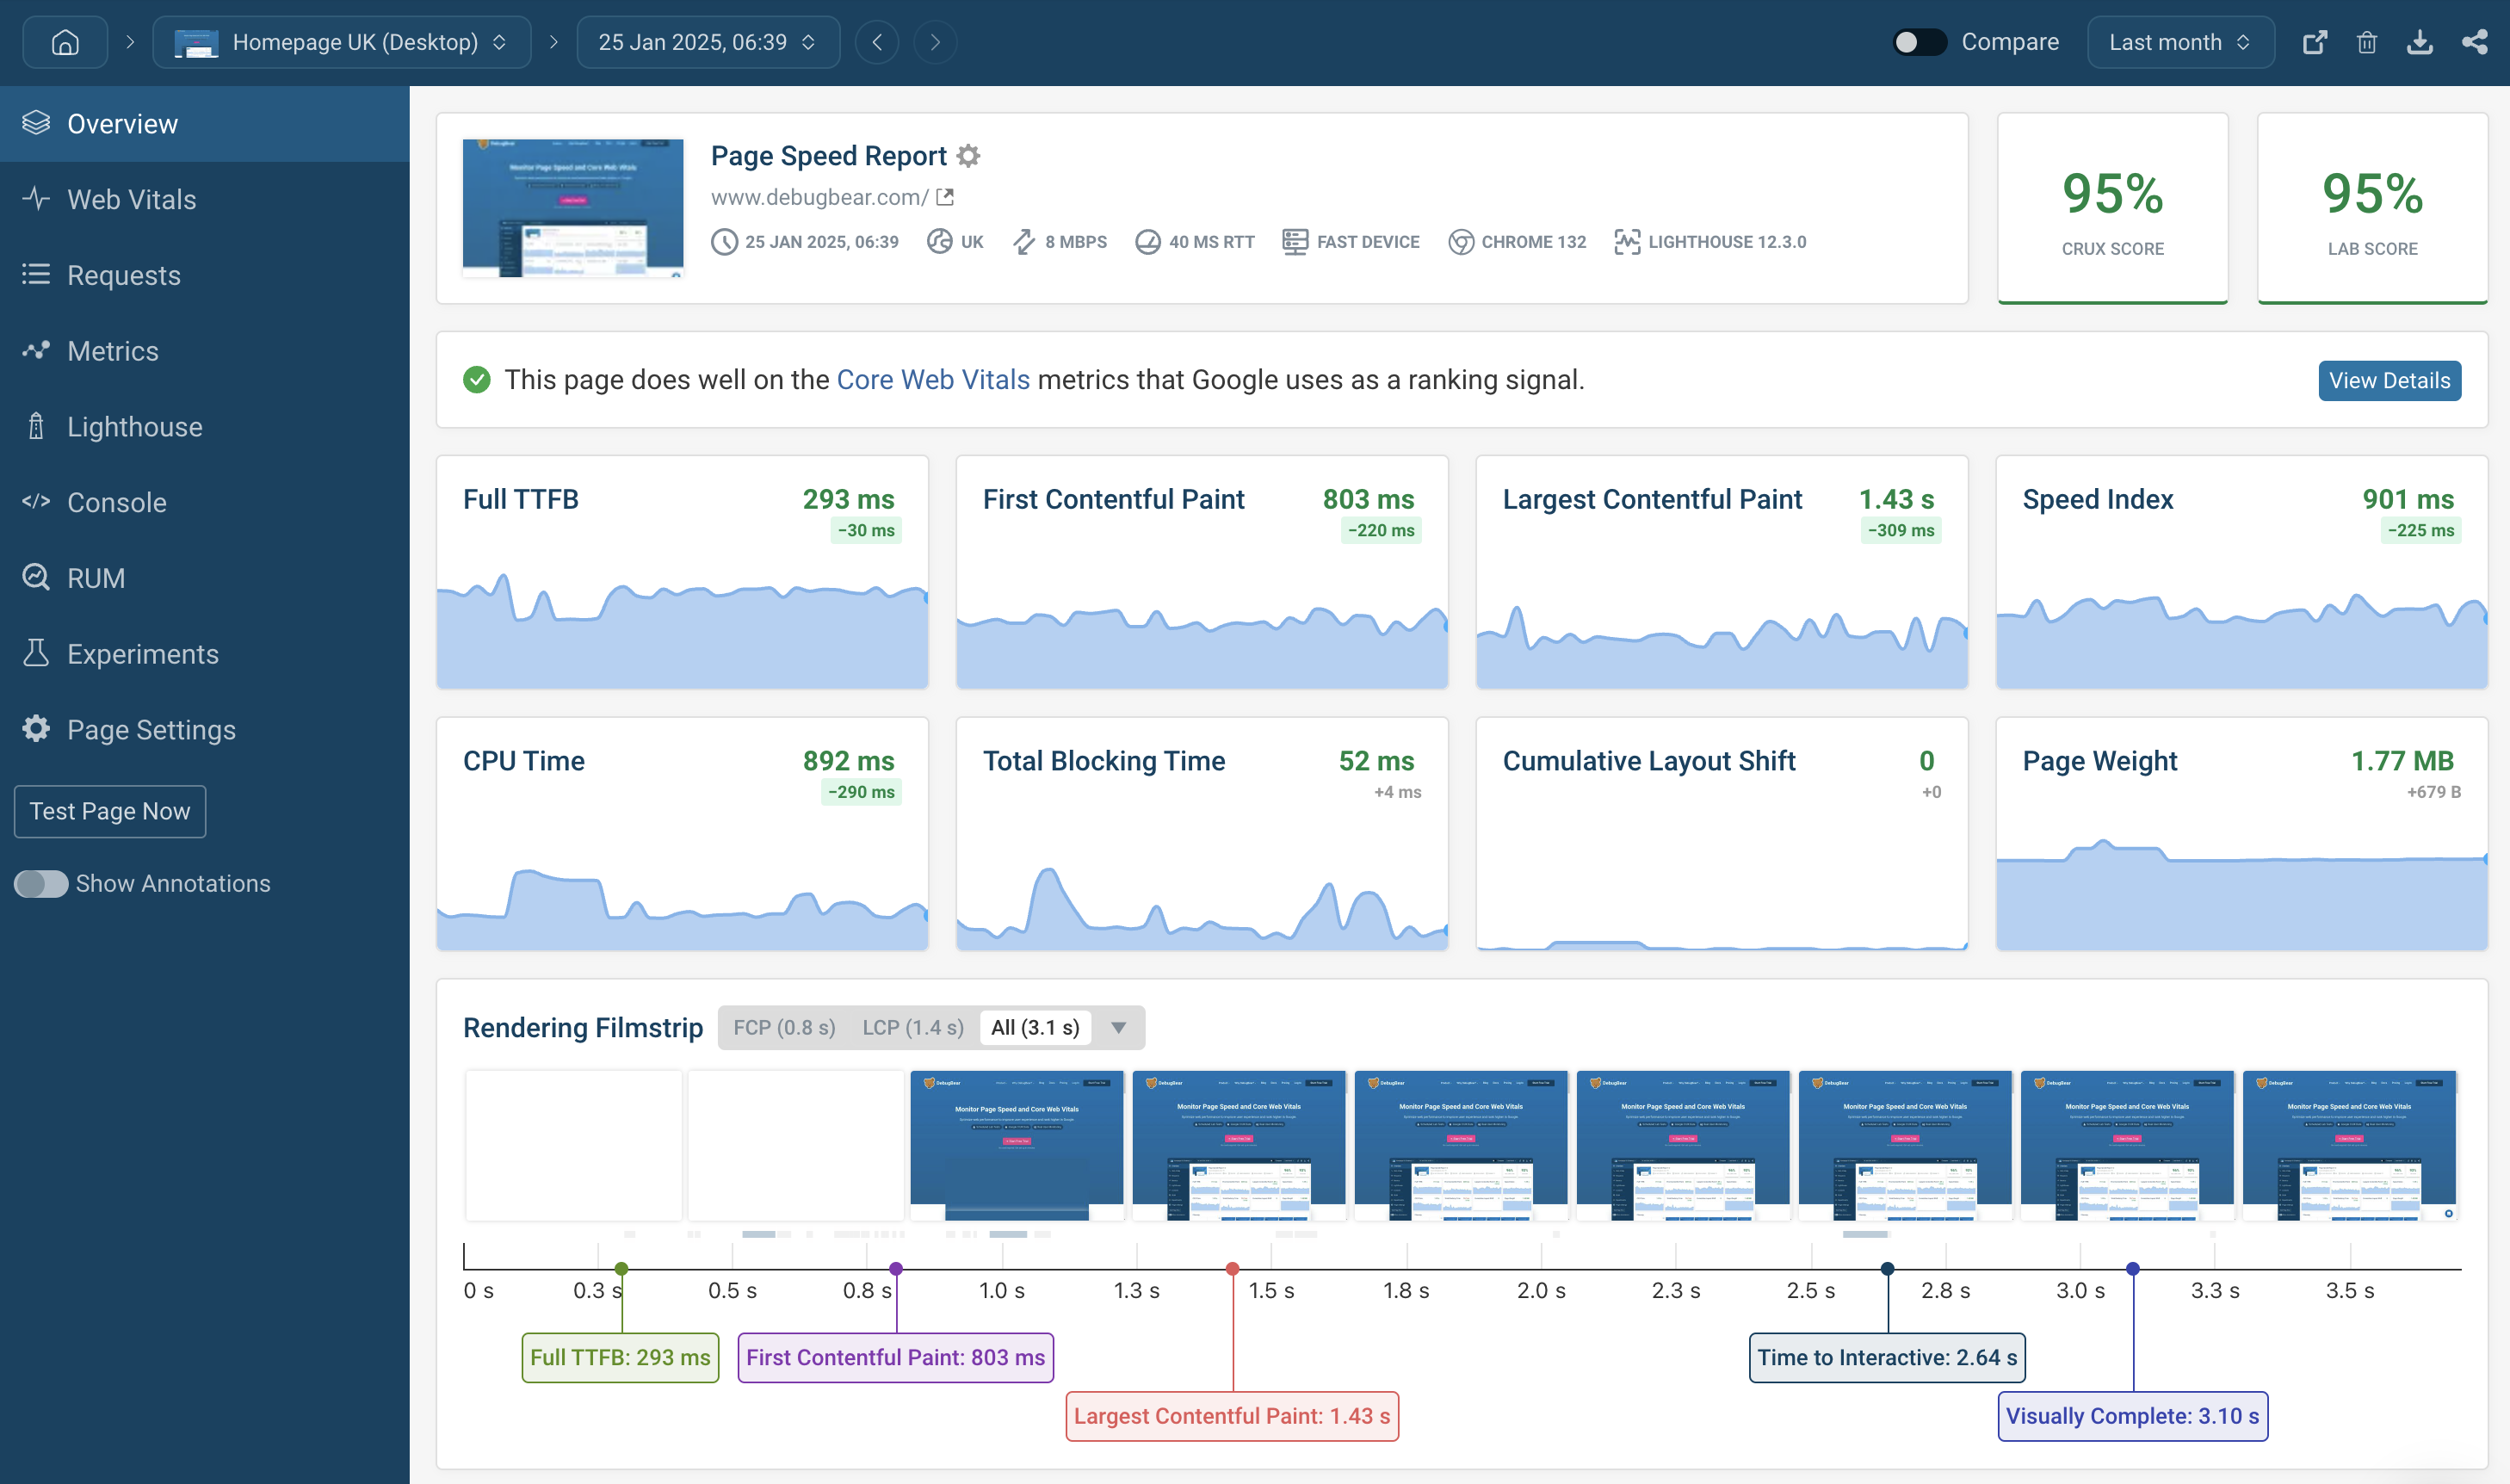
DebugBear dashboard displaying detailed performance metrics and trends.
Best Practices for Optimizing Website Performance
To complement monitoring, adopt these practices:
- Optimize images and use lazy loading.
- Minimize HTTP requests by combining files.
- Leverage browser caching and CDNs.
- Regularly update plugins and code.
- Test on real devices and networks.
- Use AMP for mobile if applicable.
- Monitor third-party scripts’ impact.
These habits keep your site speedy and efficient.
Case Studies: Real-World Impacts
Case studies highlight the value. For example, Vodafone improved page speed and saw a 31% increase in sales. Yelp’s optimizations reduced load times, boosting engagement by 15%.
In another, an IT firm achieved a 93% performance score after optimizations, leading to better UX. eBay found that every 100ms delay cost 1% in sales.
These examples show tangible ROI from monitoring and optimizing.
Conclusion
Monitoring your website performance is key to success in 2025. By tracking metrics, using top tools, and following best practices, you can ensure a fast, reliable site that delights users and drives growth. Start today—your visitors (and your business) will thank you.

